
The ASX commodities supercycle offers five categories to watch in Australia: a diversified copper-iron ore miner, pure-play copper developer, operating lithium producer, low-cost gold producer, and rare-earths-focused critical minerals company. No specific tickers are recommended; screen each for production cost, balance-sheet strength, dividend history and franking-credit balances before sizing positions.
The risk is not missing the thesis. The risk is acting on it without a framework. This guide works through the macro case, the ASX opportunity set, portfolio construction and the ATO rules that determine what you keep after tax.
What Is a Commodities Supercycle?
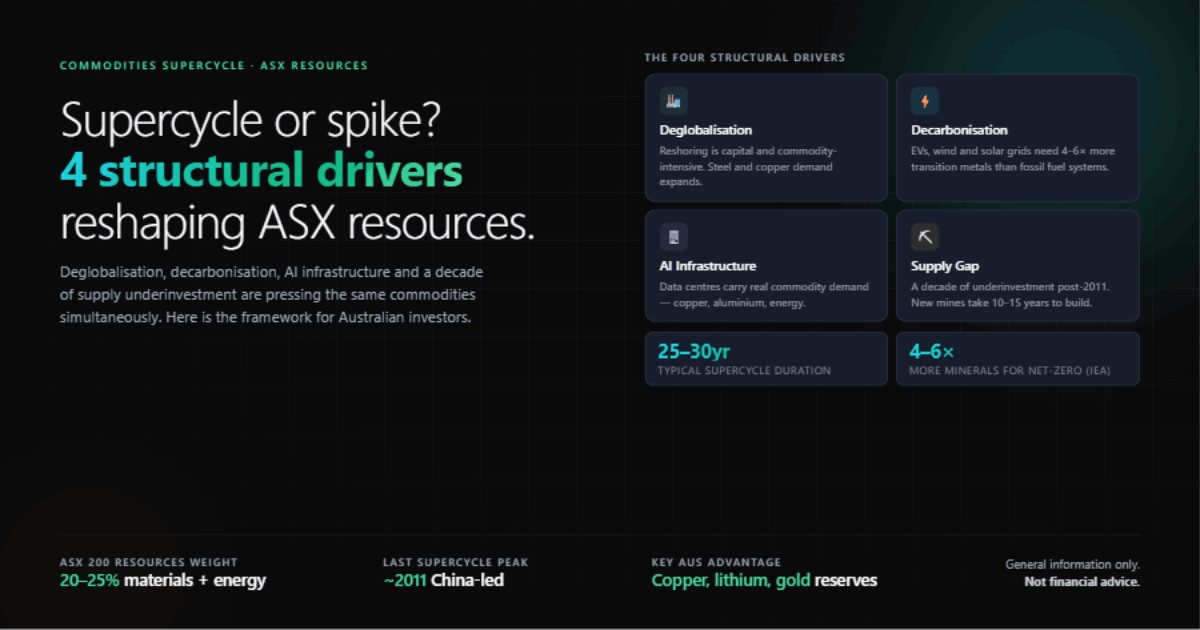
A commodities supercycle is a multi-decade period in which commodity prices stay well above their long-run averages because of structural shifts in demand and supply — not a short-lived price spike. These cycles typically run 25 to 30 years and unfold in two phases: an investment phase, where supply scrambles to catch up with surging demand, and an exploitation phase, where the new capacity finally arrives. The distinction from an ordinary cyclical price spike is crucial. A cyclical spike lasts months to a few years and reverses once supply responds or demand softens; a supercycle persists because the underlying demand driver is simply too large and too durable for supply to absorb quickly. That durability is what makes it an investment thesis rather than a trade — if the demand shift is real and structural, elevated prices can be sustained long enough to reward patient positioning. The key question is whether today strength reflects a genuine structural driver or just another cyclical upswing.
Structural demand vs cyclical price spikes: what is the difference?
A commodities supercycle is a multi-decade period during which commodity prices remain well above long-run averages due to structural shifts in demand and supply. Typical duration is 25 to 30 years, with two distinct phases: an investment phase where supply scrambles to catch up, and an exploitation phase where new capacity arrives.
You can think of a cyclical price spike as a run lasting months to a few years, reversing when supply responds or demand softens. A supercycle persists because its demand driver is too large and too durable for supply to absorb quickly.
What happened in the China-led supercycle of the 2000s?
The most recent supercycle ran from the late 1990s to around 2011, driven by China’s industrialisation. Steel, iron ore and thermal coal demand surged as China built infrastructure at a pace the global mining industry had never seen. Australian miners and the federal budget benefited enormously. That cycle ended when Chinese growth slowed and the supply investment it triggered finally reached the market.
Why does duration change the investment calculus?
If you are investing in a cyclical upswing, short holding periods are defensible. If you are investing in a multi-decade supercycle, the 50% CGT discount for assets held more than 12 months becomes a structural advantage, not a footnote. Understanding which environment you are in shapes every decision below.
What are the four structural drivers behind supercycle 2.0?
The case for a new supercycle rests on four structural demand drivers operating at once. The first is deglobalisation and reshoring: as nations move manufacturing and critical supply chains closer to home, they consume steel, copper and industrial metals at volumes that differ from a purely consumption-led profile, and reshoring is capital- and commodity-intensive by nature. The second is decarbonisation: electric vehicles, renewable energy grids and battery storage require copper, lithium, nickel and rare earths in quantities fossil-fuel systems never did — the International Energy Agency estimates a net-zero pathway needs four to six times more minerals. The third is AI infrastructure, whose data centres and power demands carry their own substantial commodity footprint. The fourth is chronic underinvestment in mining capacity, which constrains supply just as these demand sources accelerate. What makes the thesis compelling is that these drivers are additive and long-dated — together they create the durable, broad-based pressure on supply that defines a structural supercycle rather than a passing rally.
How do deglobalisation and reshoring drive demand?
Nations are moving manufacturing and critical supply chains closer to home. This requires steel, copper and industrial metals at volumes that differ from a consumption-led demand profile. Reshoring is capital-intensive and commodity-intensive by nature.
Why does decarbonisation boost transition metals?
Electric vehicles, renewable energy grids and battery storage require copper, lithium, nickel and rare earths in quantities fossil-fuel-based energy systems did not. The International Energy Agency estimates a net-zero pathway requires four to six times more minerals than the current energy system. Australia holds significant reserves of these transition metals.
What is AI infrastructure’s commodity footprint?
Data centres require copper wiring, aluminium cooling systems, steel structures and enormous volumes of electricity. AI infrastructure build-out is an indirect but real source of commodity demand that most retail commentary has not fully priced into the supercycle thesis.
How does underinvestment in mining capacity affect supply?
After the 2011 bust, mining companies slashed capital expenditure for nearly a decade. New mine development has a lead time of five to fifteen years. Even if demand signals are clear today, supply cannot respond immediately. This lag is what gives the structural demand story its price impact.
Why does Australia have unique commodities exposure?
Australia has unusually concentrated exposure to a commodities supercycle because resources dominate its export income. When commodity prices rise, Australia terms of trade improve, corporate tax receipts increase and GDP growth accelerates — the 2000s mining boom funded a decade of federal budget surpluses, and a genuine new supercycle would carry similar implications for the national balance sheet. For investors, the more important feature is the currency link. The Australian dollar has a well-documented positive correlation with commodity prices: when iron ore and copper rise, the AUD tends to follow. That creates an amplifier effect for anyone holding domestic resource stocks — you benefit from rising commodity prices flowing through to miners earnings and dividends, while the stronger AUD reflects the same underlying strength. The flip side is that this concentration cuts both ways: a downturn pressures resource earnings, the AUD and the broader economy together. So Australian investors are already heavily geared to the commodity cycle, often more than they realise.
How do the terms of trade link the AUD and ASX resources?
Australia’s export income is dominated by resources. When commodity prices rise, Australia’s terms of trade improve, corporate tax receipts increase and GDP growth accelerates. The 2000s mining boom funded a decade of budget surpluses. A genuine new supercycle carries similar implications for the federal balance sheet.
The AUD has a well-documented positive correlation with commodity prices. When iron ore and copper rise, the AUD tends to follow. This creates an amplifier effect for Australian investors in domestic resource stocks: you benefit from rising commodity prices and a stronger currency simultaneously. The risk runs in reverse. A supercycle that stalls sends both commodity prices and the AUD lower together.
Do you have hidden resources concentration in your portfolio?
The ASX 200 allocates roughly 20 to 25 per cent of its weight to materials and energy. If you hold a broad ASX index ETF or a default superannuation fund with significant Australian equity exposure, you already have material resources exposure before you buy a single mining share. Many Australian investors underestimate this starting point.
How do you map the commodities opportunity set?
Mapping the opportunity set means sorting commodities by how strong and structural their demand story is. Transition metals sit at the centre of the thesis: copper is the backbone of electrification, required by every EV, wind turbine and solar installation; lithium underpins battery technology; and rare earths are essential for electric motors and defence applications. These carry the clearest structural demand argument and align most directly with decarbonisation. Bulk commodities are a more contested case. Iron ore remains Australia largest export by value, but its demand outlook is debated — Chinese steel consumption is past its peak growth phase, even as India and parts of South-East Asia pick up some slack. Gold occupies a different role again, valued less as an industrial input and more as a currency hedge and store of value through uncertainty. The practical approach is to match each category to your conviction and horizon: transition metals offer the strongest structural narrative, while bulk commodities and gold play more cyclical or defensive roles.
Which transition metals matter most: copper, lithium, rare earths?
Copper is the backbone of electrification. Every EV, wind turbine and solar installation requires it. Lithium underpins battery technology. Rare earths are essential for electric motors and defence applications. These commodities sit at the centre of the decarbonisation thesis and attract the clearest structural demand argument.
What is the outlook for iron ore and thermal coal?
Iron ore remains Australia’s largest export by value. Its demand outlook is more contested. Steel consumption in China is past its peak growth phase, though India and Southeast Asia represent newer demand centres. Thermal coal faces structural headwinds from energy transition policy but remains in demand across Asia near term. These bulk commodities offer shorter-term cash flows and fully franked dividends, but carry more political and demand-profile risk over a 10-year horizon.
Is gold a good currency hedge?
Gold responds to real interest rates, USD weakness and geopolitical uncertainty rather than industrial demand. Within a resources allocation, gold provides diversification against scenarios where transition metal demand disappoints.
What are the five ASX categories to watch?
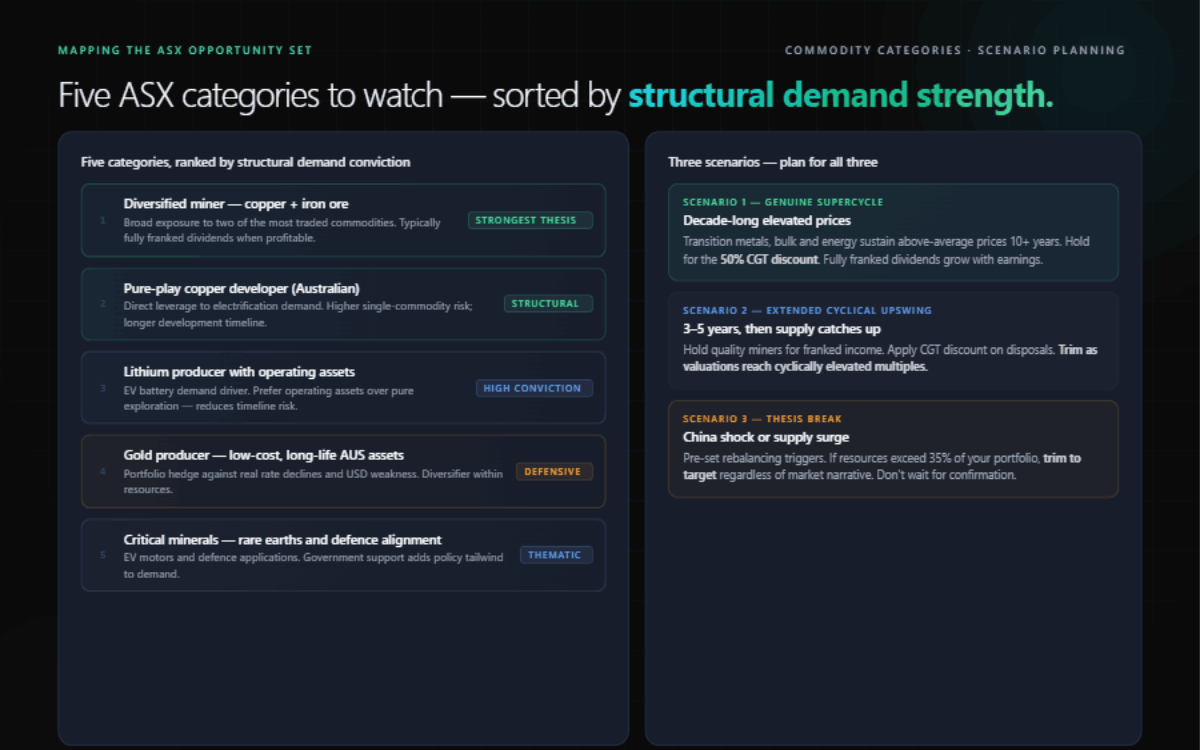
No specific tickers are recommended here. You can keep an eye on the five categories worth monitoring:
- A major diversified miner with exposure to copper and iron ore
- A pure-play copper developer in Australia
- A lithium producer with operating assets, not just exploration
- A gold producer with low-cost, long-life Australian assets
- A critical minerals company aligned to rare earth demand
Screen each against production cost, balance sheet strength, dividend history and ATO-reportable franking credit balances before sizing any position.
How much should you allocate to resources?
Deciding how much to allocate to resources starts with measuring how much you already hold — usually more than expected. Add up your ASX index ETF exposure, your superannuation Australian-equities allocation and any direct mining shares, and most Australian DIY investors find their true resources exposure is already 15 to 30% of total portfolio value before making a single active decision. Only once you know that baseline can you size a deliberate position sensibly. The vehicle choice then shapes the trade-offs. Direct ASX miners offer franked dividends, concentrated commodity exposure and simple Australian cost-base tracking, but leave you exposed to single-company risk. Global resources ETFs offer geographic diversification across the world miners, but their distributions are typically unfranked and carry foreign-income components that complicate your tax. Dollar-cost averaging into an inherently volatile sector helps manage entry timing. The disciplined sequence is: measure your real starting exposure first, decide whether to add to it, then choose between franked direct miners and diversified global ETFs based on your tax position.
How do you measure your true starting allocation?
Add up your ASX index ETF exposure, your superannuation’s Australian equities allocation and any direct mining shares you hold. Most Australian DIY investors find their true resources exposure is 15 to 30 per cent of total portfolio value before making a single active decision.
Direct ASX stocks vs global resources ETFs: which to choose?
Direct ASX miners offer franked dividends, concentrated commodity exposure and simple Australian cost base tracking. Global resources ETFs offer geographic diversification, but distributions are typically unfranked and carry foreign income tax offset complexity.
If a commodities supercycle pushes the AUD higher, an unhedged global resources ETF returns less in AUD terms than its USD performance suggests. A hedged version removes this drag at a cost. Your ETF currency choice requires a view on the AUD, not just the commodity.
Should you dollar-cost average into a volatile sector?
Resources stocks are among the most volatile on the ASX. A single Chinese economic data release or change in iron ore port inventory can move prices 5 per cent in a day. Dollar cost averaging — buying a fixed AUD amount at regular intervals — reduces the risk of deploying capital at a peak and avoids the behavioural trap of waiting for a perfect entry point that never arrives.
What are the three scenario-planning outcomes?
Rather than betting on one forecast, the sensible approach is to plan for three outcomes. In Scenario One — a genuine decade-long supercycle — transition metals, bulk commodities and energy sustain elevated prices for ten or more years, fully franked dividends grow, and a larger resources allocation held patiently to access the CGT discount rewards disciplined investors. In Scenario Two — an extended but ultimately cyclical upswing — prices stay elevated for three to five years before supply catches up; here the play is to hold quality miners for franked income, apply the 12-month CGT discount on disposals, and begin trimming as valuations reach cyclically elevated multiples. In Scenario Three — a thesis break, such as a sharp Chinese demand shock — the structural story fails and prices fall back. Mapping your response to each scenario in advance, rather than reacting in the moment, is what separates a considered resources strategy from a momentum bet, and it keeps tax front of mind since holding period directly affects your after-tax return.
Scenario Two — An extended but cyclical upswing: Prices remain elevated for three to five years before supply catches up. Hold quality miners for franked income, apply the 12-month CGT discount on disposals, and begin trimming as valuations reach cyclically elevated multiples.
Scenario Three — Thesis break: A sharp Chinese slowdown, faster-than-expected supply response or technology substitution breaks the thesis. Commodity prices fall sharply and the AUD weakens. Pre-set rebalancing triggers protect you here. If resources rise to 35 per cent of your portfolio, trim to your target allocation regardless of market narrative.
Write down your target allocation and rebalancing bands before you invest. A band of plus or minus 5 per cent around a 20 per cent target means you act at 25 per cent or 15 per cent, not on sentiment.
How are commodities investments taxed in Australia?
Commodities investments are taxed under standard CGT and dividend rules, and the supercycle thesis happens to align neatly with tax efficiency. Under ATO rules, individuals and trusts holding an asset for more than 12 months before disposal are eligible for a 50% CGT discount on the net capital gain. Every trade, though, is a CGT event: it triggers a tax liability on any gain and resets the 12-month clock, so frequent trading both crystallises tax and forfeits the discount you would earn by waiting. That is why a buy-and-hold approach aligned to a multi-year supercycle is not just a macro strategy but a tax-efficient one. On the income side, large Australian miners typically pay fully franked dividends when profitable, and those franking credits represent company tax already paid at the 30% corporate rate — which investors can offset against their own tax, with refunds available to those on lower or zero rates. Combining patient holding for the discount with franked dividend income makes domestic miners particularly tax-effective for long-term investors.
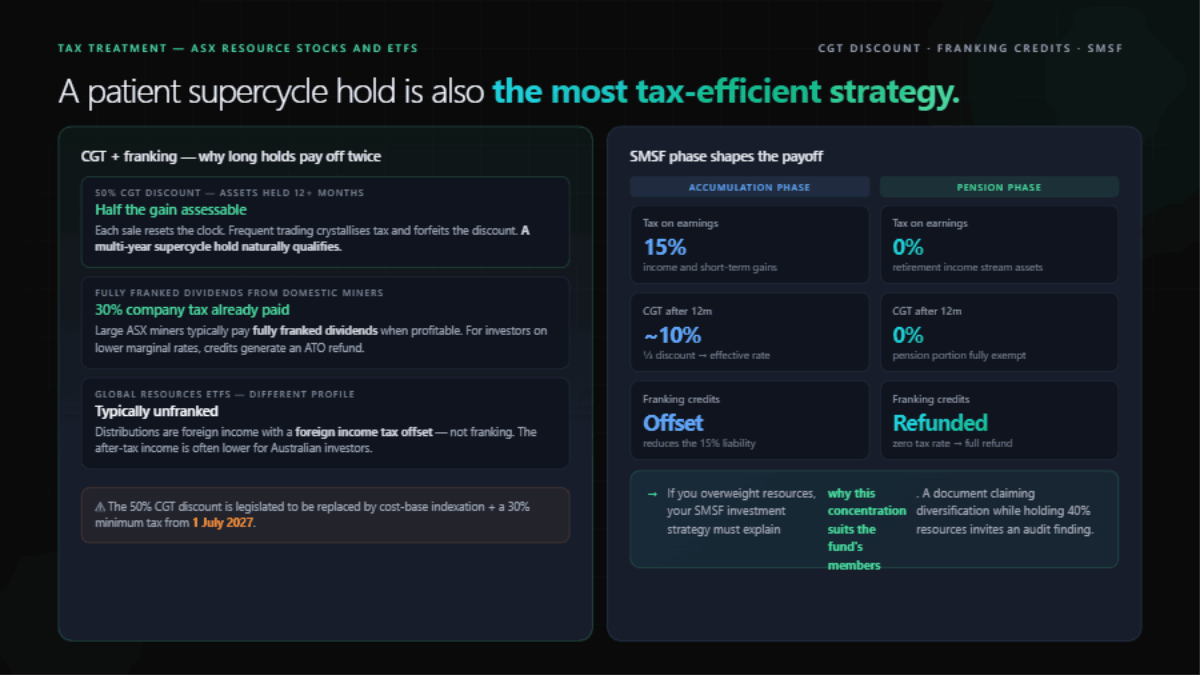
Note: the 50% CGT discount is legislated to be replaced by cost-base indexation and a 30% minimum tax on net capital gains from 1 July 2027; the treatment described here applies to disposals before that date.
How does the 12-month CGT discount rule work?
Under ATO rules, individuals and trusts holding an asset for more than 12 months before disposal are eligible for a 50% CGT discount on the net capital gain. Each trade creates a CGT event, triggers a tax liability on any gain and resets the 12-month clock. A buy-and-hold approach aligned to the supercycle thesis is not just a macro strategy. It is a tax-efficient one.
How do franking credits from miners work?
Large Australian miners typically pay fully franked dividends when profitable. Franking credits represent company tax already paid at 30 per cent. For investors whose marginal tax rate is below 30 per cent, or for pension-phase SMSFs paying zero tax on earnings, franking credits generate a refund from the ATO. Global resources ETFs distribute foreign income tax offsets, not franking credits. The after-tax income is often lower for Australian resident investors.
How do you track your cost base?
Resources investors who trade across multiple parcels must maintain accurate cost base records for each parcel. Dividend reinvestment plan units are taxable acquisitions and must be recorded at their issue price. Without clean records, you risk overstating gains, understating losses or attracting ATO scrutiny. Platforms like Crowdfolio are built for Australian DIY investors who need to track cost base, franking credits and estimated CGT across multiple holdings without managing spreadsheets manually.
What extra obligations do SMSF trustees have?
SMSF trustees carry extra obligations that a concentrated resources position can directly trigger. Trustees must maintain a written investment strategy addressing risk, return, liquidity, diversification and the fund ability to meet benefit payments — not a one-off formality but a document that has to match the actual portfolio. If you overweight resources, the strategy must explicitly explain why that concentration is appropriate for the fund members; a document claiming to be diversified across asset classes while the fund holds 40% resources is the kind of mismatch that invites an audit finding. The fund tax phase then shapes the payoff: an SMSF in accumulation phase pays 15% tax on earnings, while in pension phase the rate on earnings supporting retirement income streams generally falls to zero, making franked dividends and discounted capital gains especially valuable there. The practical steps are to document the rationale for any concentrated exposure, keep the strategy consistent with real holdings, and weigh the fund phase when timing disposals.
How do you document concentrated sector exposure?
SMSF trustees must maintain a written investment strategy addressing risk, return, liquidity, diversification and the fund’s ability to meet benefit payments. If you overweight resources, your investment strategy must explain why this is appropriate for the fund’s members. If your strategy document says “diversified across asset classes” but your holdings are 40 per cent resources, expect an audit finding.
What are the pension-phase tax advantages?
An SMSF in accumulation phase pays 15 per cent tax on earnings. In pension phase, the tax rate on earnings supporting retirement income streams is zero. For CGT, an accumulation-phase SMSF holding an asset for more than 12 months receives a 33⅓% CGT discount, reducing the effective CGT rate from 15 per cent to 10 per cent. In pension phase, the CGT liability on the pension-supporting portion is zero. This makes patience through volatile resources cycles more rewarding for SMSF investors who plan ahead.
Frequently asked questions
How do I know how much resources exposure I already have through a broad index ETF?
Check the sector weights in your ETF’s product disclosure statement. The ASX 200 allocates approximately 20 to 25 per cent to materials and energy combined. Add any superannuation exposure to Australian equities, then decide whether you want to increase that allocation actively.
Does a rising AUD reduce returns on my unhedged global resources ETF?
Yes. A 10 per cent AUD appreciation against the USD erodes roughly 10 per cent of your unhedged return. A currency-hedged version removes this effect but carries its own hedging costs.
Does the ATO treat franked dividends from ASX miners differently from ETF distributions?
Yes. Franked dividends include imputation credits you offset against your income tax liability. ETF distributions include multiple components — Australian income, foreign income, foreign income tax offsets and sometimes capital gains distributions — each taxed differently and reported using the ETF provider’s annual tax statement. The compliance burden for ETF distributions is higher.
What documentation does an SMSF trustee need when overweighting ASX resource stocks?
Update your investment strategy document to reflect the higher sector concentration, the rationale for it, and how it remains consistent with the fund’s risk profile and liquidity needs. Your auditor will review this document annually. The documentation must match the actual portfolio.